In under 10 minutes you will see a “living map” of your shop floor: where manufacturing orders go, how quality is controlled, why machines stop, and what your OEE figure really says. This article breaks down the 5 key data flows of an MES (work orders, quality, traceability, maintenance/Andon, OEE & events) in a “apply it as you read” style — enough for you to pilot 1 line, 3 operations this week.
You will get:
- 1 data flow diagram connecting devices–MES–ERP without the clutter.
- A quick-start checklist (screens, codes, scanning devices).
- 10 core KPIs to measure correctly from day one (OEE, FPY, MTTR…).
If you are busy, this is the summary that helps you spot bottlenecks in 15 seconds and act in the next shift.
1) MES là gì? Khác gì ERP/SCADA?
MES (Manufacturing Execution System): the operational software layer on the shop floor — turning manufacturing orders into action and recording in real time (WIP, quality, OEE, traceability).
ERP: planning and accounting (orders, MPS/MRP, inventory – finance).
SCADA/PLC/IoT: equipment control/measurement → MES sits in the middle, talking to both ERP and equipment, turning scattered data into standard processes and KPIs.
2) The 5 core data flows to do first
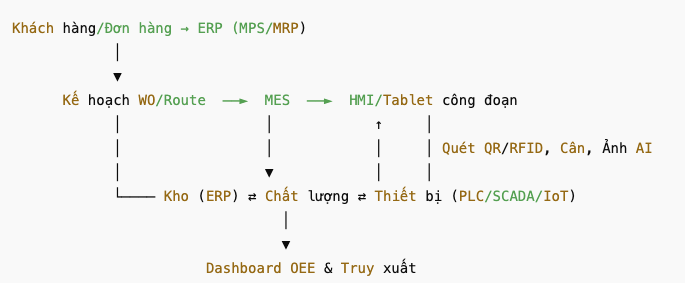
MES overview diagram
2.1) Work orders & routing (WO & routing)
a) Goal
Turn a “production order” into concrete work on the shop floor: which product, in how many steps, and on which machine for each step.
b) What to prepare
- WO (work order): WO code, product, quantity, due date.
- Routing: the list of steps (step 10, 20, 30…), the machine used and the standard time.
- (If any) Norms: the materials required for each product.
c) How it works
- Receive the WO from ERP or create it quickly on the shop floor.
- Attach the routing to the WO → Release it so workers can scan and start work.
- If production data already exists, don't edit the WO haphazardly: create a new version and record the reason.
d) Screens you need
- WO Board: danh sách WO theo line/ca, nút Release/On Hold.
- Route viewer: see the sequence of steps (10→20→30) and which steps have quality checks.
e) Pitfalls to avoid
- Every WO must have a routing; the routing must have at least 1 step.
- Clear coding conventions, no duplicates.
f) Metrics to track
% of WOs released on time; % of WOs with missing information; WO creation time.
Quick example
WO-001 (100 units) has 3 steps: Cutting → Welding → Painting. Once released, workers at each step can scan WO-001 to start.
2.2) Production reporting
a) Goal
Record who did it – at which step – at what time – how much was produced (OK/NG). This is the “lifeblood” of MES.
b) What to prepare
- WO code, operation step, machine, shift, operator.
- OK/NG quantities (and weight, if a scale is used).
- Identification: scanning QR/barcode is the minimum; RFID can be added.
c) How it works
- Start a step: scan the WO (and the lot, if any) → press Start.
- Finish: enter OK/NG (can be read from the scale) → press End.
- For large lots, split into several entries (one crate/pallet each) to be safe.
d) Screens you need
A dedicated screen for each operation: large Start/Pause/End buttons; a scan field; a large numeric keypad; a Split button (split crates).
e) Pitfalls to avoid
- Do not allow End until OK/NG has been entered.
- Block cases where the end time is earlier than the start time.
- Compare actual speed with standard speed to detect anomalies.
f) Metrics to track
Output per shift; % defects (NG); speed vs. standard; number of late entries.
Quick example
The welding step of WO-001: the worker presses Start at 08:05 and End at 08:45, recording 45 OK – 2 NG. The system calculates the working time and updates output automatically.
2.3) Quality
a) Goal
Catch defects early right at the operation, and store evidence (measured values/photos/signatures) for later traceability.
b) What to prepare
- QC point: what to inspect, how often, acceptance limits (LSL/USL), sample size.
- Results: pass/fail or measured values; evidence (photos, notes).
- Actions: accept / rework / scrap / quarantine.
c) How it works
- At a step with QC, the system prompts for inspection at the set frequency.
- Enter values (or pull them automatically from scales/sensors), attach photos if needed.
- If it fails: create a non-conformance (NC) report and choose an action (quarantine, rework…).
d) Screens you need
- A compact QC form: value fields, the standard range displayed, pass/fail checkbox, photo button.
- The QC history of the same lot being processed, for comparison.
e) Pitfalls to avoid
- Do not allow a step to be completed if mandatory QC is not finished.
- Alert when several consecutive results are close to the limit (a negative trend warning).
- Seriously failed lot → automatically quarantined.
f) Metrics to track
FPY (first pass yield), % fails by criterion, defect handling time.
Quick example: The painting step requires weighing the paint coating (2% ± 0.5%). 5 out of 100 products must be weighed. One sample exceeds the limit → the system creates an NC and quarantines that lot.
2.4) Traceability
a) Goal
Know which raw materials went into which semi-finished goods and then which finished goods. When something goes wrong, trace backward/across in 1 minute.
b) What to prepare
- Lot/serial for raw materials, semi-finished and finished goods (each code is unique).
- A link table: input lot → output lot, together with WO, step, machine, shift and operator.
c) How it works
- Entering an operation: scan one or more input lots.
- Leaving an operation: create/scan the output lot.
- The system stores the “parent–child tree” between lots.
d) Screens you need
- Genealogy tree: click a finished product to see the semi-finished goods and raw materials it was made from.
- Where-used: select a raw material to see which finished goods it went into.
e) Pitfalls to avoid
- Do not allow an output lot to be created if an input lot is in quarantine.
- If too many raw materials are mixed into one semi-finished lot, the system suggests splitting the lot for easier management.
f) Metrics to track
Time to trace one lot; % of lots with complete information (WO/shift/machine); number of missing links.
Quick example: RM-A and RM-B → SF-C; then 3 SF-C → FG-D. When a customer complains about FG-D, one click shows which lot of RM-A, which shift and which machine it used.
5) OEE & lean maintenance
a) Goal
Know the run/stop/micro-stop status of machines, why they stop, and resolve issues fast with Andon tickets. From there, calculate OEE and MTBF/MTTR.
b) What to prepare
- Machine status: run/stop/setup/micro-stop; start/end times; stop reason.
- (If any) a counter/pulse signal to count output.
- Andon ticket: fault description, start/end times, who handled it, corrective action.
c) How it works
- Take signals from IO/PLC or let workers change the status manually.
- When a stop exceeds X minutes → a reason must be selected and an Andon ticket opened.
- Once fixed → close the ticket and record the corrective action.
d) Screens you need
- Andon light board per line: one colored tile per machine (green running, red stopped…).
- Quick downtime reason popup; buttons to create/close Andon tickets.
e) Pitfalls to avoid
- Machine reports Run but no output for > Y minutes → alert.
- Machine in Stop with no reason for > X minutes → recording discipline alert.
f) Metrics to track
Overall and per-machine OEE, top-3 downtime, MTBF/MTTR, micro-stop rate.
Quick example
A machine stops for 12 minutes “waiting for materials”; an Andon ticket is opened at 09:10 and closed at 09:22. At the end of the shift, the dashboard shows this reason among the top downtime causes.
3) 10 decisive KPIs (short definitions + measurement frequency)
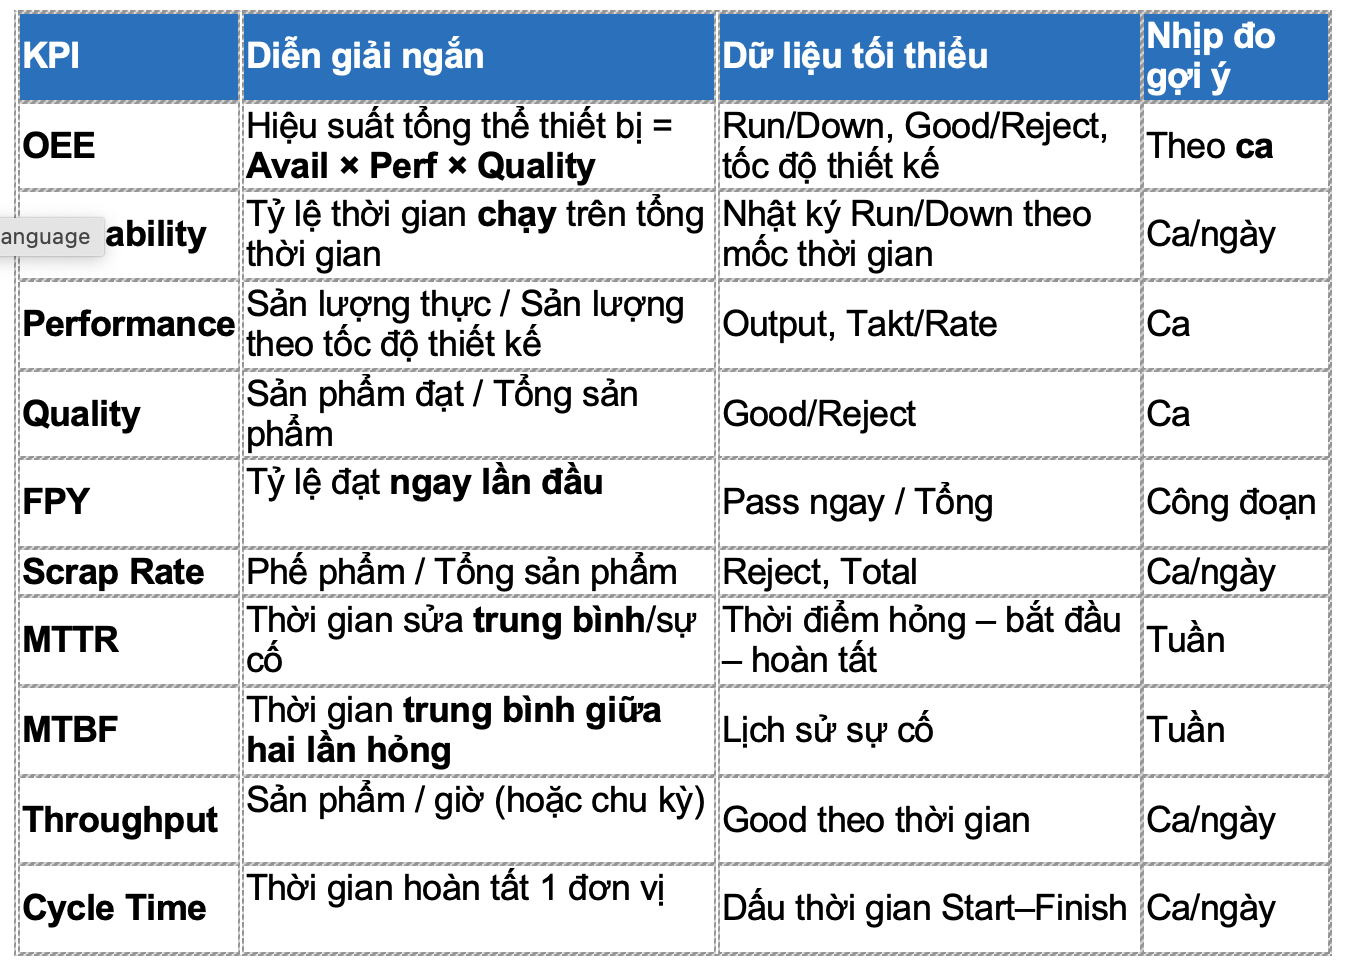 Lock down KPI definitions from the start so every shift measures the same way. Set 30/60/90-day targets: OEE +5–10 points, FPY +2–3 points, MTTR −20%…
4) Prerequisites for running MES (a “quick-start” MVP)
Master data you need ready:
Products + BoMs, operations/routes, machines/lines, shift calendars, and QC criteria.
Scanning/reading devices:
QR/barcode scanning is mandatory . Devices such as scales, IO/PLC, cameras/vision are accelerators but not mandatory from the start.
Data entry screen design:
One screen per operation, with actions taking < 10 seconds (Start/Stop, Good/Reject). Support short offline operation if the network goes down.
ERP/warehouse connection:
Record receipts–issues by lot/serial so that inventory does not drift and to support traceability.
5) A 90-day implementation roadmap (lean & low-risk)
Weeks 0–2 (understand the current state & design the rollout)
- Draw a value stream map (VSM) for 1–2 product lines; agree on target KPIs (e.g. OEE +10%, WIP -20%).
- Finalize the coding standards (lot/serial, machine, operation).
Weeks 3–6 (pilot)
- Roll out 2 key operations + 1 line; switch on WO, reporting, basic QC and OEE.
- Connect barcodes; scales/RFID/vision if ready.
- Run in parallel for 2–3 shifts and finalize the process.
Weeks 7–12 (expand & stabilize)
- Expand to the whole line/route; add full traceability; dashboards for GMs/supervisors.
- Standardize training & SOPs; control changes.
6) Sample dashboard (55'' screen – grasp the situation in 15 seconds)
- Quick KPI tiles: show current shift OEE, good/reject output (OK/NG), FPY, and the top 3 machine stop reasons.
- Line status: Run / Stop / Micro-stop lights per machine, so you can see at a glance which machine is “down”.
- WIP heatmap: color-code work-in-process levels by operation to spot bottlenecks instantly.
- Kanban-style WO board: each WO shows % complete and estimated completion time (ETA), with late warnings.
- QC panel: shows prominent defect (NG) rates, top defect codes, with photo evidence (if any).
7) Expected benefits (typical values*)
- OEE up ~5–15% after 3–6 months: fewer micro-stops, standardized line changeover/mold change times.
- Internal WIP/lead time down ~20–40%: bottlenecks are clearly visible and resolved quickly, so goods don't get “stuck” at operations.
- Traceability time down ~30–60%: when there is a quality/customer issue, lot/serial lookups are much faster.
- Scrap & rework down ~10–25%: in-process quality control catches problems early.
* Reference ranges from discrete manufacturing projects. Actual results depend on system maturity and operational discipline.
8) Risks & how to avoid them
- Messy data / non-standard codes → Agree on coding conventions (SKU/lot/serial) and block invalid input right on the form.
- Overly complicated forms → Design few fields – in the right place, favoring scanning over typing.
- Measuring too many metrics → Keep only the 10 core KPIs above; leave the rest to periodic reports.
- Rolling out to the whole factory at once (big-bang) → Run a pilot on 1–2 lines first, and scale up only once it is stable.
- The night shift doesn't “buy in” → Train by shift, give shift leaders clear KPIs and follow up daily.
9) Checklist nhanh
- Choose a small scope: 1 product – 1 line – 3 main operations.
- Lock in 90-day KPIs: OEE, FPY, MTTR, throughput (targets by shift/week).
- Standardize master data: lot/serial, machines/lines, shift calendars.
- Design 4 minimum screens:
- Receive WO, 2) Report output (Start/Stop, Good/Reject),
- QC (measurement sheet + defect codes), 4) Andon/Downtime.
- Devices & network: 2 scanners per station, stable Wi-Fi, accounts by shift (user per shift).
- SOPs & training: 1–2 page SOP per group; 2 hours of training per group + a test; a data error handling process.
- Dashboard & meeting rhythm: switch on the dashboard at the line; a 15-minute daily meeting to review KPIs, defects and actions for the day.
10) Golden rules for integration
ERP ↔ MES: Rõ “ai làm gì”
ERP only handles planning & bookkeeping: it sends WOs down and receives completion confirmations and stock receipts/issues back.
Every action on the shop floor (pressing Start/Stop, reporting Good/Reject, QC, Andon…) goes through MES.
Devices ↔ MES: favor lightweight, “instant” signals
Connect small, real-time events such as Start/Stop, pulse counts, weights.
Avoid sending heavy continuous data streams unless truly necessary (they use bandwidth and are hard to maintain).
Unified coding: “one code = one meaning”
Standardize codes and avoid duplicates: WO, lot/serial, route steps, machine/line codes.
Write coding conventions and block invalid input right on the form.
Data maintenance: keep a full trail
Log every change, never delete history.
Design traceability so you can look up by WO/lot/serial in a single click (for audits and fast incident handling).
Final thoughts
Understanding MES doesn't have to be complicated: just grasp the 5 key data flows — work orders, quality, traceability, lean maintenance/Andon, OEE & events — and you have a foundation to see – control – improve your shop floor in real time. Start small: 1 line, 3 operations, 10 core KPIs (OEE, FPY, MTTR…), standardize codes (WO/lot/serial), and favor scanning and lightweight events from devices. After 2–4 weeks of measuring correctly, you will know where the bottlenecks are, make faster decisions and build momentum to roll out across the factory.
Contact SmartBiz for a free consultation and demo of the solution, and let us roll it out with you ‘fast, lean and with visible numbers’